This is somewhat of a sequel to my earlier post on Google URL Builder. I’m going to assume from this point forward that you have Google Analytics up and running on your site, you’re using URL Builder to track people coming in from social media, PPC and e-mail campaigns, and now you want to use Analytics to, well, analyze the data coming in. That’s what this article is all about.
Analytics is daunting when you first start it up — there’s a ton of data. We’re going to stay focused in this post, though, and go over a few key sections as they relate to campaigns, referrals and blog traffic.
Finding Your Campaigns
Click Acquisition, then Campaigns.

Click Acquisition, then Campaigns.
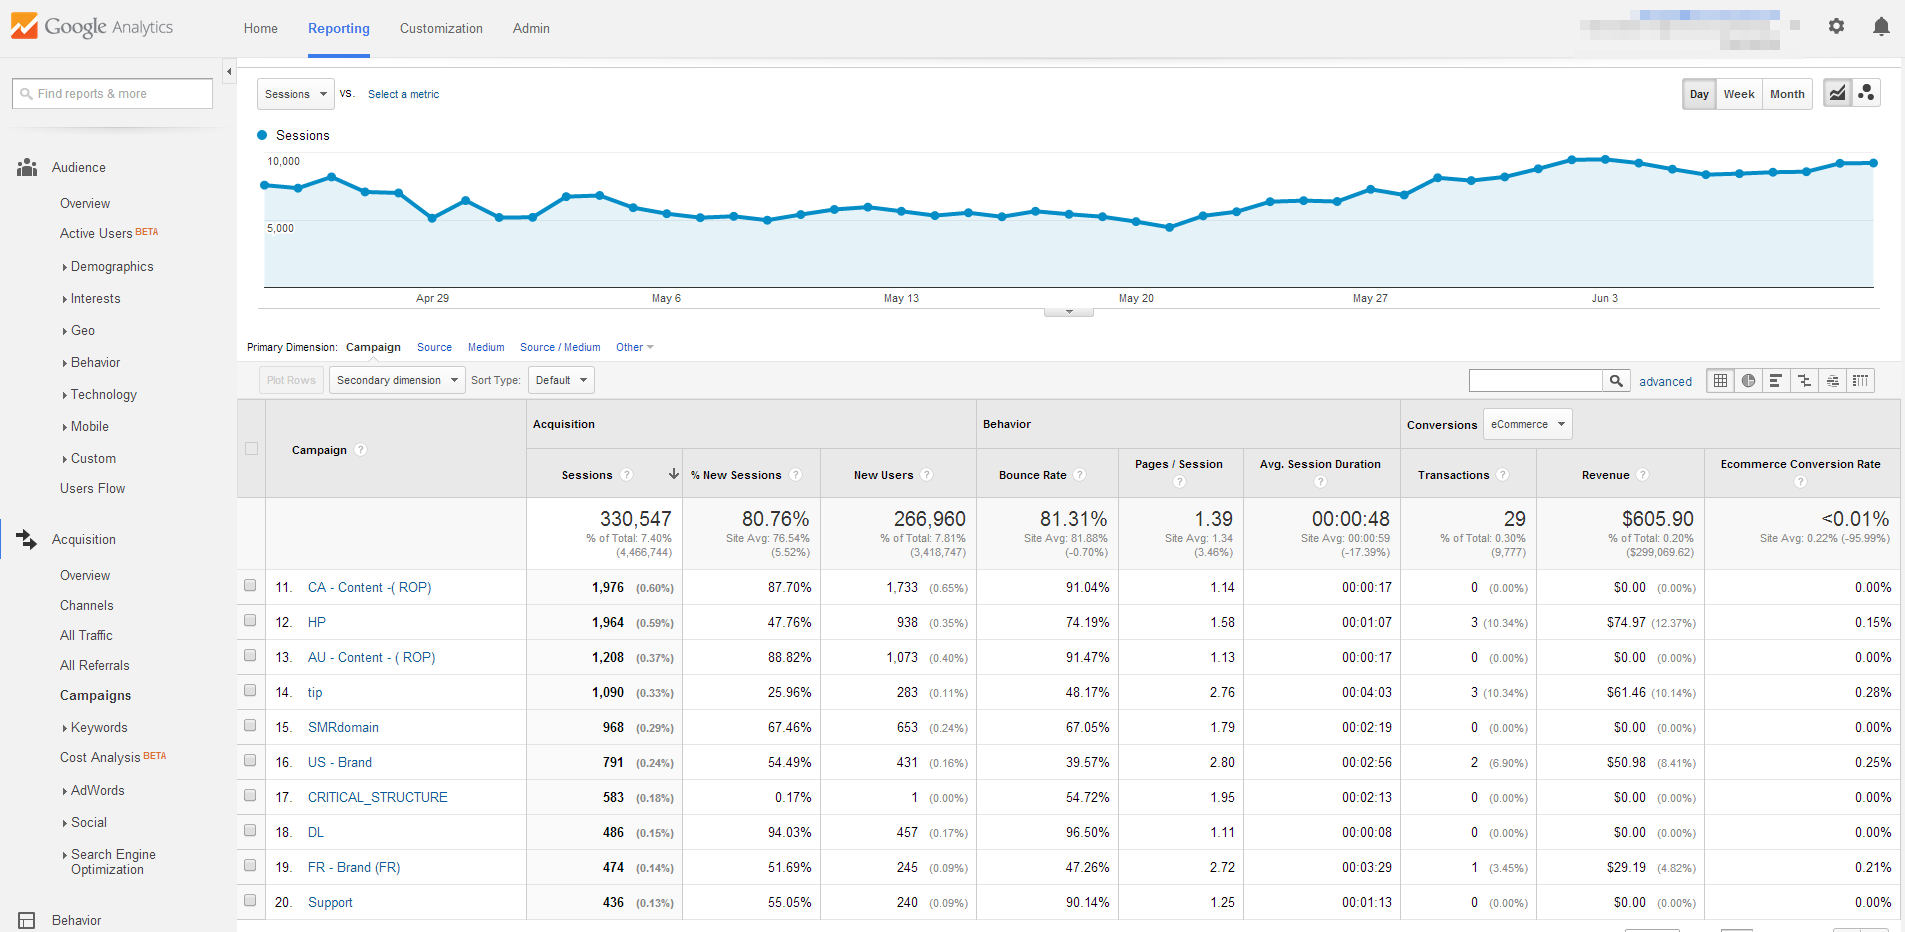
Look for your specific campaign name. Remember, you named this after the specific piece of content you ran with that call to action built in. In this case, let’s click on “tip”, the first in a series of product tips built into an application.
We can see here the source is Product for all, as we ran this same campaign across many different mediums, but the same source — all products. If we ran these same tips on Facebook, we’d see Facebook in the first column.
In the second column is the medium, in this case named after each product. Crunching the numbers here, we can see that the DR product did much better than the others in this campaign. Comparing multiple source / mediums in a single campaign is great for seeing how different types of sources perform in comparison with one another.

You can see that the different mediums all have the same source.
What do these numbers mean?
Sessions
Sessions are a somewhat new term in analytics that describes a period of time that a user is engaged with your website. Sessions contain pageviews, but also events and e-commerce. In this case, there were 4,098 sessions during the four-month period we’re looking at.
New Sessions
This is the percentage of new users that make up your sessions. A high New Sessions percentage means you’re getting a ton of turnover, with a lot of new people looking at your content, but not a lot of repeat business. A low New Sessions percentage means you’ve got a hardcore base of steady customers, but not a lot of new people coming in. Balance is good here, depending on the source.
New Users
This is the number of new people that showed up during this period — people who have never been to your site as long as Analytics has been tracking it. Businesses like new customers, so a high number here is good.
Bounce Rate
This is a tricky, and frequently misunderstood term. Bounce rate refers to people coming in to your site, spending some time there, and leaving for an external site from there without checking out any other page. Lower is better here, as you want the customer to stay engaged whenever possible. There are many tricks for keeping your customers on your site and clicking around, from using Related Posts plugins on your WordPress blogs, to including calls to action or “carrots” that keep the user engaged and informed.
Keep in mind that if you’re driving traffic to a landing page and you don’t really want them to go anywhere else besides signing up right there, this percentage is going to be high. That’s not necessarily a bad thing, depending on your goals.
Pages / Session
If your bounce rate is nice and low, then your pages / session is going to be higher. This means that people are clicking around and checking out more of the site when they come and visit.
Average Session Duration
Good, quality content will keep the user and potential customer on your site and reading for a long time. If you’re old like me, you remember the “Where’s the Beef?!” Wendy’s commercials. Having a lot of “beef” means that users will spend a lot of time there, and hopefully get into what you want them to get into — a conversion.
The other columns only work if you have e-commerce connected to your Analytics account, and that’s beyond the scope of this article. Let’s check out another part of Analytics instead.
Referrals
Click Referrals, then look for social media. These are the times that people click over to your site when you’re not necessarily using URL Builder (though you should be using it most of the time). Maybe they found the URL in your About section. Maybe they found it from someone else’s Facebook page.
Find the first Facebook link you see, but don’t click on it. Facebook divides traffic into desktop and mobile, and sometimes divides it even further in esoteric ways. This is a good way to see how your total efforts on Facebook are having an effect on site traffic.

Facebook.com refers to desktop Facebook traffic only.
Comparisons
In the upper right, click the arrow and select Compare To. Select Previous Period to choose the immediately preceding period of the same length, or select Previous Year to do a year-over-year comparison. Select Custom to choose what periods you’re comparing. Then, scroll back down to your social media referral source. In this case, Facebook desktop traffic grew 57% from one four-month period to the next four-month period. That’s outstanding.

Facebook traffic grew 57% over the period analyzed.
There’s one last part of analytics we’re going to check — how to track your internal content and how it’s doing.
Blog Traffic
- Click Behavior
- Click Site Content
- Click All Pages
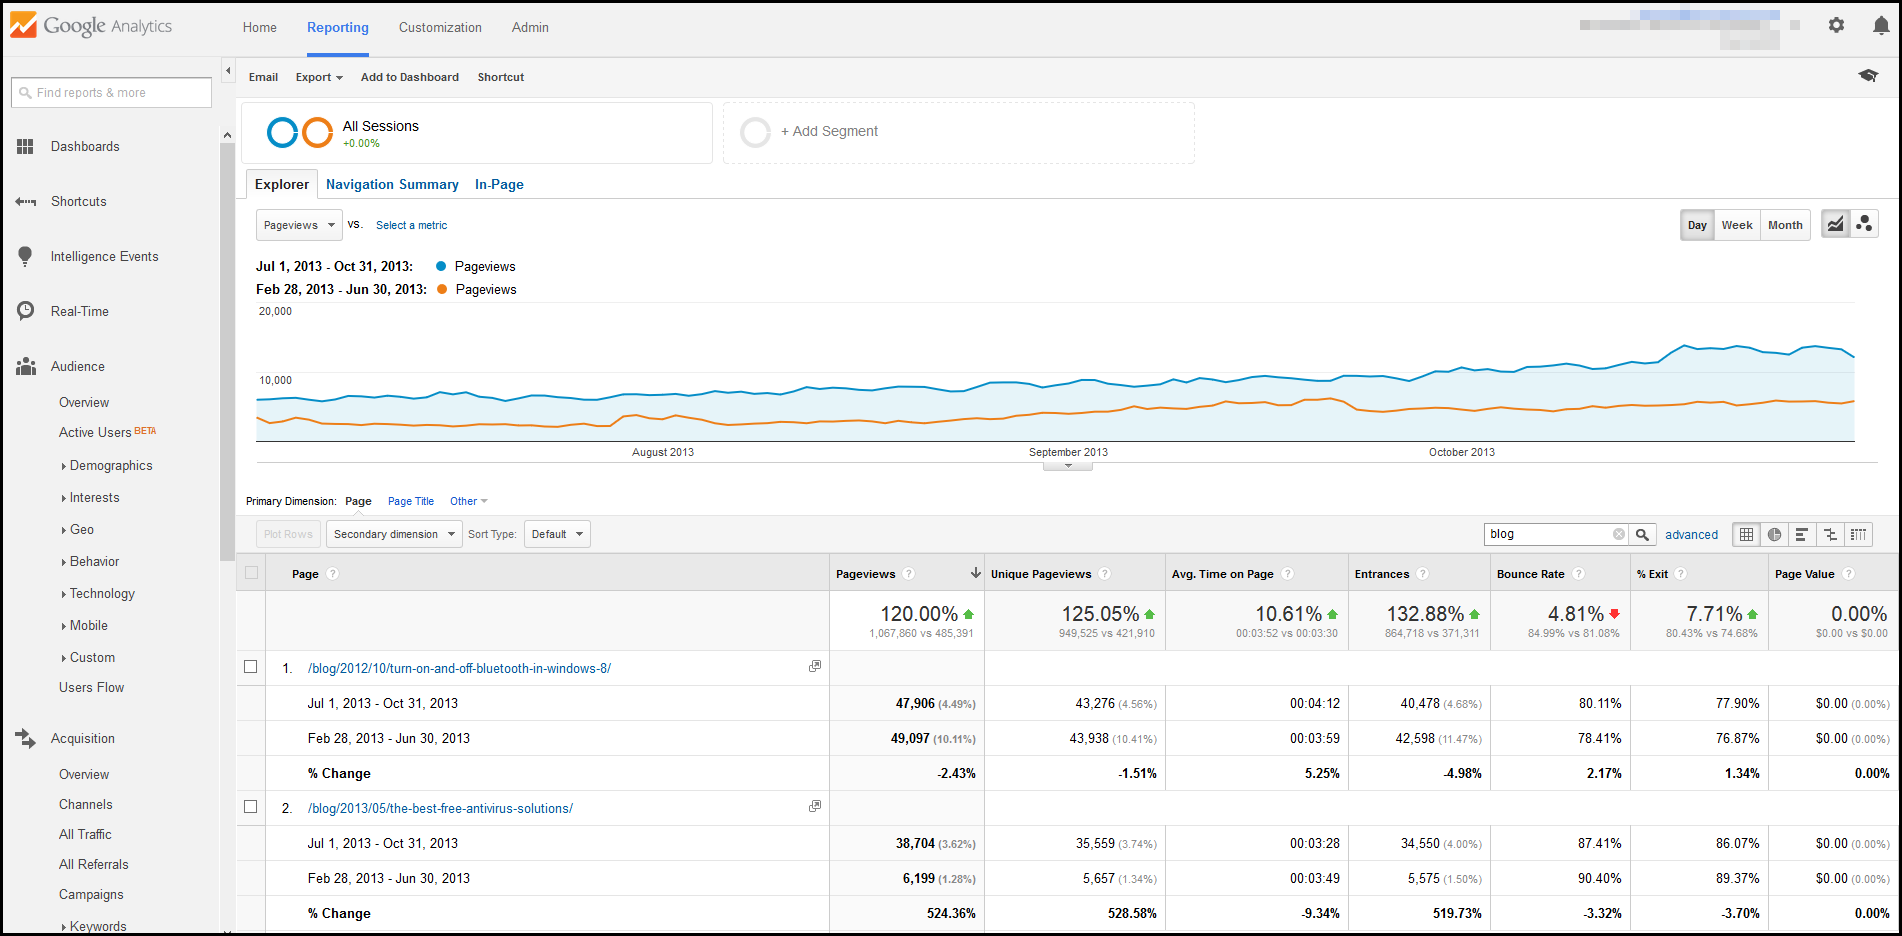
In the search box, type blog. This assumes that your blog is at sitename/blog/ — if it’s under /news/, then search accordingly. (If you don’t use a subfolder, skip this step.)
Run the same comparison as before.
You can see how your blog is improving over the same time period, and you can also look at individual posts and see how they’re doing over time. Evergreen posts, especially, can sometimes grow over time and become viral long after the date they were first published. This is a good way to identify those posts that are doing well and optimize them for keywords and SEO so that they do even better.

See how individual posts perform over long periods of time.
There’s a Lot More
Google Analytics is a bottomless pit of data about your site, its behavior and the behavior of the people that visit it. Explore and find more useful data here, and share that data with clients. Clients like to see numbers going up, and if you’re doing your job, they will — and everyone’s happy!
Content is King
Bottom line — you’re referring people from an e-newsletter or social media or an app to your website. You want users to have a reason to enjoy your site when they get there, stay there, read things, and buy stuff. You get that by having a well-designed site, sure, but also by having quality content. Content that’s relevant, timely, engaging, well written, well-designed (with good images!) and above all, original. Do that, and you’re giving users a great reason to leave their social media caves and check out what you’ve got to offer.


