

 Infographics are literally information paired with a graphic design element. They’re designed to inform and educate you with a lot of data and statistics, but in a visual way that makes it easier to read and remember.
Infographic searches on Google increased 800% from 2010 to 2012, and likely have increased even more since then. It’s one of the best ways to get information across to a public that largely filters out most of what they read. That’s why data visualization is so crucial.
Infographics are beneficial in marketing for a number of different reasons, one of the most important of which is that they provide great SEO benefits. Infographics are often picked up by other websites or blogs because the content is ready-made and easily shareable.
In addition to increasing brand awareness, this can provide a great boost to your overall search engine optimization (SEO) and link-building strategy due to the link backs you earn. And the rising tide lifts all ships: you will find your core keywords performing better, as well as a huge increase in “long-tail” inbound search terms. The result is often increases in traffic, leads, sales and revenue.
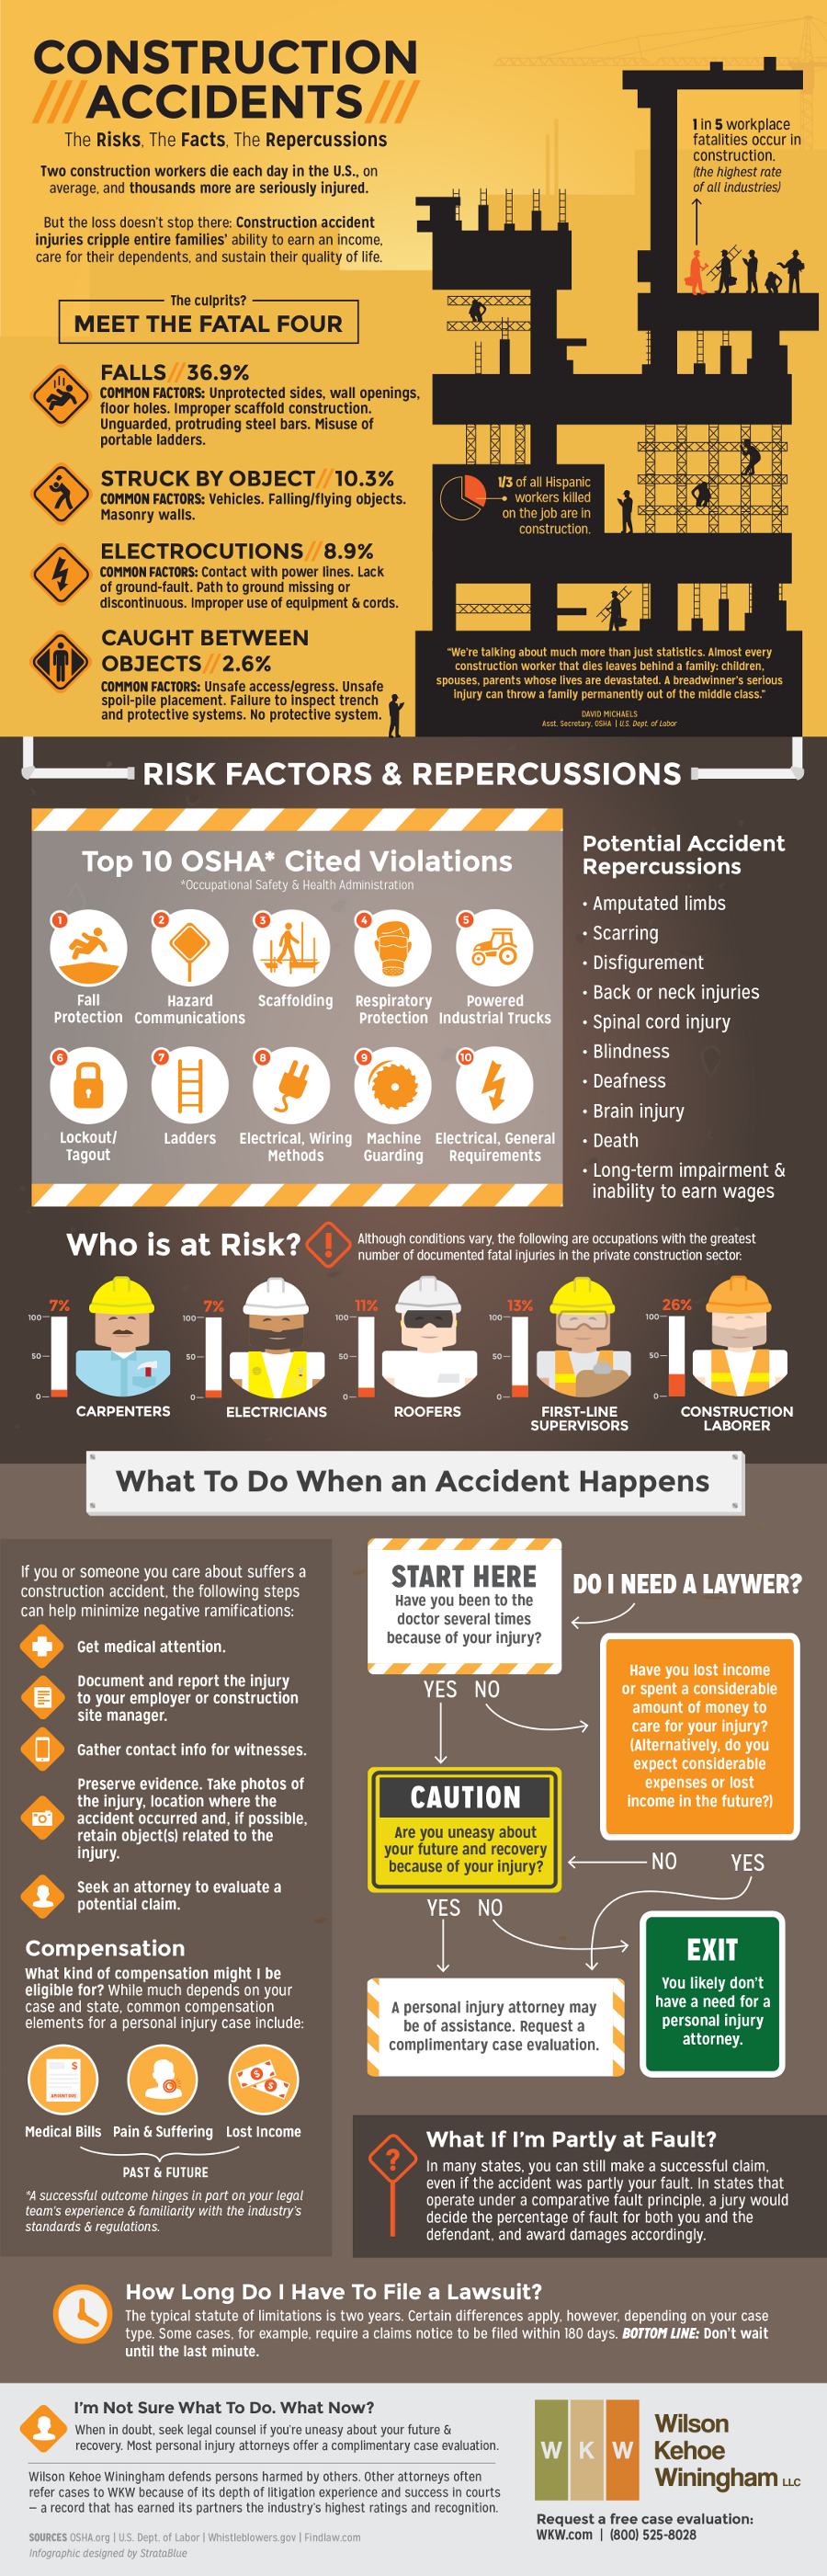
The team at StrataBlue designed the Construction Accidents infographic on the right for one of our clients — the Indiana-based law firm Wilson Kehoe Winingham. Our goal was to educate interested readers about the risks and repercussions associated with working construction jobs.
We’ve been sharing and pitching this infographic strategically all over the Web, and it’s already appeared in places like the Environmental Health & Safety newsletter and on Visual.ly.
StrataBlue’s Senior Graphic Designer, Suzanne McGill, recently gave a talk on infographics marketing at the National Association of Bar Executives Conference. Below are the slides from that talk. Suzanne has a lot to say about what makes an effective infographic.
P.S. Suzanne also designed the infographic. If you’d like to work with her and the rest of the StrataBlue team to educate the public using infographics like this, get in touch.
[slideshare id=39818195&doc=showdonttellinfographicssuzannemcgillstratablue-141002165523-phpapp02]
